1929 → 2026 — The Next Great Reset
June 2026 · Geopolitics · 15 min read
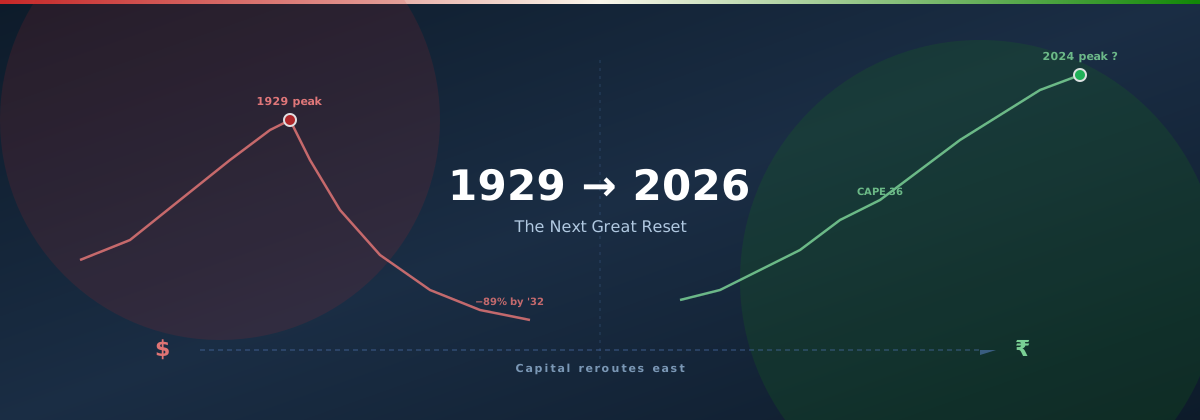
The structural set-up looks uncomfortably 1929. The exit won't. And the country that benefits most from how the exit plays out is probably India.
This is a piece I've been putting off writing because the conclusion sounds like a "buy India" pitch dressed up as macro analysis. The data made me write it anyway. I'll show the bullish case, the bearish case, and what I think is settled vs. what's open. None of this is investment advice. All of it is testable.
1. What 1929 actually was
The 1929 crash is misremembered as just a stock market event. It was a regime change.
1929 wasn't just a crash. It was the start of a 15-year reshuffle that ended with the dollar replacing the pound sterling as the world's reserve currency, the gold standard abandoned, the US becoming the world's industrial centre, and a multi-decade transfer of capital from the old empires to the new one. The shape of the global financial system in 1945 was unrecognisable from 1925.
Crashes don't just destroy value. They reorder where the value goes next.
2. 2026 looks uncomfortably similar — by the numbers
Almost every structural indicator that flashed red in 1929 is flashing red again, in some cases brighter. This isn't conspiracy talk. It's the data.
Shiller CAPE ratio (S&P 500), 1900 → 2026
Today's CAPE is higher than the 1929 peak. The only time it has been higher was the dot-com bubble, which preceded a 49% drawdown over three years. Note: high CAPE doesn't mean a crash tomorrow. It means the long-run expected return from these levels is structurally low — and the asymmetric downside risk is structurally high.
Other structural signals worth ranking on the same scale:
3. Why 2026 is structurally different from 1929 (the exit changes)
What's similar is the set-up. What's different is the exit. The exit changes everything about where capital ends up.
- No gold standard to come off. In 1929, currencies were anchored to gold. The crisis forced an unanchoring (1933 in the US, formally everywhere by 1971). In 2026, currencies are already unanchored — the next shock won't break a monetary regime; it will break a hegemonic one.
- Multipolar finance is already here. Dollar share of FX reserves: 59% and declining. Euro: 20%. RMB: 2.5% but growing 4× in a decade. Gold reserves at central banks: highest absolute level since the 1970s. The world has already started diversifying without waiting for permission.
- Industrial capacity is in Asia already. In 1929, the US was the world's manufacturer. Today, the US is 16% of global manufacturing output. China is 31%. The "manufacturing centre" reshuffle that took 30+ years post-WW2 doesn't need to happen this time — it already happened.
- Settlement rails are programmable. CBDCs, RMB-denominated settlement (now ~50% of China–Russia trade), UPI international linkages with 7+ countries — the infrastructure for non-dollar global trade exists in a way it simply did not in 1929 or 1971.
- Demographics flipped. US, Europe, China, Japan all face shrinking working-age populations through 2050. India, Indonesia, Nigeria, Vietnam expand. The labour scarcity story re-routes capital alongside the geopolitical story.
The implication: the next crisis doesn't transfer hegemony to the next single power. It transfers hegemony to a basket — RMB for energy and East Asia trade, EUR for European integration, INR-pegged baskets for South Asia and Africa, gold and crypto as neutral reserves. The dollar doesn't collapse. It demotes.
USD share of global FX reserves, 2000 → 2024
4. The Manufacturing Reroute — already in motion
The "China +1" playbook isn't a thesis anymore. It's a budget line item at every major manufacturer. The data has stopped being controversial:
The reroute isn't only about cost. It's about geopolitical hedging. Apple, Samsung, Foxconn, Micron, Tata, Vedanta, AMD — every name on this list has either announced or expanded India manufacturing in the last 24 months. The Production-Linked Incentive (PLI) scheme is now budgeted at ~₹1.97 lakh crore (~$23B) across 14 sectors. This is the largest industrial policy commitment India has made since 1991.
What the West routes to India during a reset:
- iPhone, Galaxy, mid-tier consumer electronics assembly. India already at 14% of global iPhone production, on track for 25%+.
- Generic pharma + APIs. India already supplies 20% of generic drugs and 60% of vaccines (by volume) globally. Becomes the default during any China-decoupling.
- Solar PV manufacturing. ~50 GW of new domestic capacity coming online — India is the second-largest solar market and rapidly closing the manufacturing gap.
- Defence manufacturing. Exports up 30× since 2014. Now ~$2.6B/year, target $5B by 2025.
- Specialty chemicals + auto components. Already a dominant supplier to Europe and Japan; benefits from any China alternative-sourcing push.
This is not "India will manufacture more." This is "India already does, and the rate of capture is accelerating."
5. The Rupee's Hour — the case, the counter-case
This is the section where I have to be most careful, because the INR-appreciation thesis is the most contested part of the whole argument. Here's both sides, with numbers.
The Bull Case for INR
- Trade surplus shift. Manufacturing exports growing 23% YoY. Services exports already at $325B+/year. Together they're closing the goods deficit.
- Remittances cushion. $129B/year — largest in the world. This is structural, not cyclical.
- Reserve growth. RBI now holds ~$675B in FX reserves — fourth-largest globally. Adds ~$50B/year.
- De-dollarisation tailwind. 30+ countries now settle bilateral trade with India in INR or local currency. RBI's rupee-trade settlement mechanism active since 2023.
- Capital inflows. India inclusion in JPMorgan EM bond index brought ~$30B passive inflows in 2024 alone. FTSE Russell inclusion now too.
- Productivity differential. Real GDP growth ~6–7% vs US 1–2%. Long-run currency theory (Balassa-Samuelson) says faster productivity growth → currency appreciation.
The Bear Case for INR
- Oil price shock. India imports 87% of its crude. A $20/barrel sustained spike adds ~$40B/year to the current account deficit.
- RBI intervention bias. RBI has historically resisted INR appreciation to protect export competitiveness. Likely caps the rate of appreciation even if fundamentals support it.
- Inflation differential. India CPI structurally ~3pp above US CPI. Purchasing-power parity arithmetic implies long-run depreciation against the dollar.
- Capital flight risk. A global risk-off event would pull FII money out of India first. Saw this in 2008, 2013 taper tantrum, 2020.
- Twin deficits. India still runs a current account deficit and fiscal deficit. A "twin-deficit" country structurally can't have a strong currency without external financing.
- Geopolitical risk premium. India's neighbourhood (Pakistan, China, Bangladesh, Myanmar) attracts a risk premium that compresses currency valuation.
Both lists are factually correct. The argument isn't which is wrong; it's which dominates during a global financial reset. My take, with appropriate humility:
- In a normal cycle, the bear case wins. INR drifts to 90–95 by 2030 on standard inflation-differential math. This is the consensus view.
- In a reset scenario, the bull case dominates. If the dollar demotes structurally and capital rebalances away from USD assets, the relative attractiveness of any economy with growth + demographics + manufacturing capture goes up materially. India is among 2–3 economies that fit all three.
- Bias I'm carrying. I'm Indian, I want this to be true, I'm reading the macro through a particular lens. Adjust accordingly.
6. USD / INR scenarios by 2030
Three concrete scenarios for INR/USD in 2030, with the assumptions stated. Not a forecast. A scenario tree to think against:
| Scenario | USD/INR by 2030 | Key assumption |
|---|---|---|
| Bear / consensus | 90 – 100 | No reset event. Standard inflation-differential math. Rupee drifts down at ~2.5%/year. |
| Base case | 78 – 88 | Soft global slowdown, modest manufacturing capture, dollar share of reserves keeps drifting 1–1.5pp/year. |
| Bull / reset | 62 – 72 | US recession + dollar demotion + 25% INR overshoot during reserve rebalancing. India captures >25% of "China +1" manufacturing flows. |
Probability weighting (my subjective view, not a forecast): Bear 45% / Base 35% / Bull 20%. Risk-adjusted expected value of INR is higher than the consensus prices in.
Even at 20% probability, the bull case is material enough that anyone hedging long-dollar exposure should be thinking about it. That's the real point of macro scenario analysis — not to predict, but to size optionality.
7. What's settled vs what's open
Sorting the certain from the contested:
Settled (high confidence, evidence-backed):
- The dollar's share of global reserves is in structural decline. Multi-decade trend. Not cyclical.
- US debt-service costs are crowding out fiscal flexibility. Already arithmetic, not opinion.
- Manufacturing capacity is decentralising from China to a basket of countries.
- India is one of the basket countries — meaningful FDI is already flowing.
- The next financial crisis, whenever it comes, will reshape capital flows the way 1929 did.
Open (genuine uncertainty):
- Timing. The fragility is real. The trigger could be 6 months or 6 years away. Anybody claiming otherwise is selling something.
- Who captures most of the manufacturing reroute — India, Vietnam, Mexico, Indonesia all compete. India isn't the only winner; it's a winner.
- How aggressively the RBI defends INR appreciation. Cultural preference at RBI is for stability over appreciation. The pace will be capped even in the bull case.
- Whether the US has a hard landing or muddles through. Fed credibility is the single most important variable. Hard to model.
- Climate and energy transitions. A disorderly transition is fiscally devastating for any oil-importer including India.
8. So what — practical takeaways
I'm cautious about prescriptive recommendations, but if you read this and want to act on the framing:
- Diversify USD exposure if you're heavily concentrated in it. The asymmetric downside on the dollar in any reset scenario is real.
- Long-duration Indian assets — equities, sovereign debt, real estate in major cities — benefit disproportionately from any version of the bull case. The base case still does fine.
- Gold + Bitcoin as neutral reserves. Whatever you think of the asset class, its role as a non-sovereign reserve grows in any reset.
- Watch the dollar reserve share quarterly. IMF COFER releases. If it drops below 55%, the conversation accelerates.
- Watch manufacturing exports from India monthly. The thesis depends on this metric continuing to compound at 15%+ YoY.
None of this is a "buy India and you'll be rich" pitch. It is: the structural map of the next 10 years has India in a position it has not been in for 300 years. The asymmetry of being wrong (small drag) versus being right and unpositioned (large opportunity cost) is what makes the argument worth taking seriously even at moderate probability.
This piece is being expanded — adding sector deep-dives (energy, semis, defence), the climate-transition cost in INR terms, and quarterly tracking of the COFER + manufacturing data in subsequent updates. Counter-arguments welcome; the standard is data, not vibes.